Multiple Choice
Identify the
choice that best completes the statement or answers the question.
|
|
|
1.
|
Lionel observes that traffic is getting worse and it’s taking him longer
to get to work. He records once a week the following data for several weeks. Graph a scatter plot
using the given data. | Week | 1 | 2 | 3 | 4 | 5 | 6 | 7 | 8 | | Time (min) | 8.2 | 8.9 | 8.6 | 8.3 | 9 | 9.7 | 8.4 | 10.1 | | | | | | | | | |
|
|
|
2.
|
Thomas is a car salesman. He is paid a salary of $1600 per month plus $300 for
each car that he sells. His salary can be modeled by the equation  where
x is the number of cars sold. Graph this equation and give its domain and range. a. | 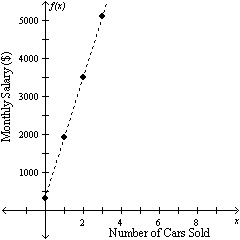
D: {$300, $1900, $3500, $5100, ...}
R:
{0, 1, 2, 3, ...} | b. | 
D: {$1600, $1900,
$2200, $2500, ...}
R: {0, 1, 2, 3,...} | c. | 
D: {0, 1, 2, 3,
...}
R: {$300, $1900, $3500, 5100, ...} | d. | 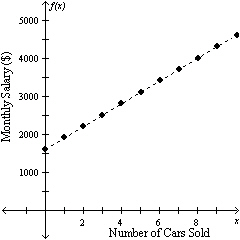
D: {0, 1, 2, 3,
...}
R: {$1600, $1900, $2200, $2500, ...}
|
|
|
|
3.
|
Salvador’s class has collected 88 cans in a food drive. They plan
to sort the cans into x bags, with an equal number of cans in each bag. Write an expression to
show how many cans there will be in each bag.
a. | 88 – x | c. |  | b. | 88 + x | d. | 88x |
|
|
|
4.
|
Complete the table shown. Then, determine whether the table shows a linear
relationship. x | 5.75 + (x + x + x)  4
4 | 3 | ? | 7 | 11 | 11 | 14 | ? | 17 | ? | 20 | | |
a. |
The table shows a linear
function. | b. |

The table does not show a linear
function. | c. |
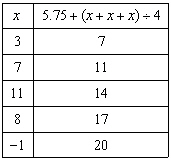
The table shows a linear
function. | d. |
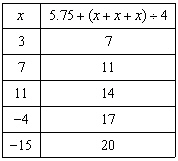
The table does not show a linear
function. |
|
|
|
5.
|
A toy company's total payment for salaries for the first two months of 2005
is $21,894. Write and solve an equation to find the salaries for the second month if the first
month’s salaries are $10,205.
a. | 
The salaries for the second month are
$21,894. | b. | 
The salaries for the second month are
$32,099. | c. | 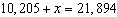
The salaries for the second month are
$10,947. | d. | 
The salaries for the second month are
$11,689. |
|
|
|
6.
|
Give the domain and range of the relation. Tell whether the relation is a
function. a. | D: {–5, –1, 3, 6}; R: {0, 1}
The relation is not a
function. | c. | D: {–5, –1, 3, 6}; R: {0, 1}
The relation is a
function. | b. | D: {0, 1}; R: {–5, –1, 3, 6}
The relation is a
function. | d. | D: {0, 1}; R:
{–5, –1, 3, 6}
The relation is not a function. |
|
|
|
7.
|
Solve 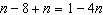 .
|
|
|
8.
|
Tell whether the relation is a direct variation. Explain. a. | This is a direct variation, because it can be written as  , where
k = –2. , where
k = –2. | b. | This is not a direct variation, because it
cannot be written in the form  . . | c. | This is a direct
variation, because it can be written as  , where , where  . . | d. | This is a direct variation, because it can be written as  , where k
= , where k
=  . . |
|
|
|
9.
|
Write the equation that describes the line in slope-intercept form.
slope =
4, point (3, –2) is on the line
a. | y = 4x – 14 | c. | y = 4x +
14 | b. | y = 4x – 2 | d. | y = 4x +
10 |
|
|
|
10.
|
Find the x- and y-intercepts of  . a. | x-intercept: –8, y-intercept: 4 | c. | x-intercept:  ,
y-intercept: 4 ,
y-intercept: 4 | b. | x-intercept:  ,
y-intercept: ,
y-intercept:  | d. | x-intercept: –8,
y-intercept:  |
|
|
|
11.
|
Graph the line with a slope of  that contains the point (3,
–7).
|
|
|
12.
|
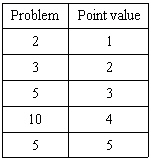
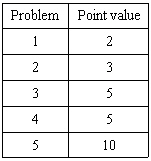
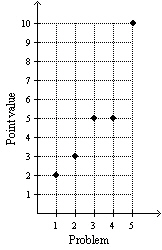
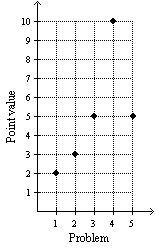
Express the relation for the math test scoring system {(1, 2), (2, 3), (3, 5),
(4, 10), (5, 5)} as a table and as a graph.
a. | Cannot determine. The set of ordered pairs is not a relation, because the elements 3
and 5 in the domain are both paired with the element 5 in the range. | b. |
  | c. |
  | d. |
  |
|
|
|
13.
|
The formula  gives the profit p when a number of
items n are each sold at a cost c and expenses e are subtracted. If  ,  , and  , what is the
value of c?
|
|
|
14.
|
Kristi rides her bike to school and has an odometer that measures the distance
traveled. She subtracts this distance from the distance to the school and records the distance that
remains between her and the school. Find the intercepts. What do the intercepts
represent? Time traveled (min) | Distance remaining (ft) | 0 | 5,000 | 2 | 3,750 | 4 | 2,500 | 6 | 1,250 | 8 | 0 | | |
a. | x-intercept = 5000; y-intercept = 8
The x-intercept
represents the distance remaining when Kristi began her bike ride. The y-intercept represents
the time traveled when Kristi arrived at school. | b. | x-intercept = 8; y-intercept =
5000
The x-intercept represents the time traveled when Kristi arrived at school. The
y-intercept represents the distance remaining when Kristi began her bike
ride. | c. | x-intercept = 5000; y-intercept = 8
The x-intercept
represents the time traveled when Kristi began her bike ride. The y-intercept represents the
distance remaining when Kristi arrived at school. | d. | x-intercept = 8; y-intercept =
5000
The x-intercept represents the time traveled when Kristi began her bike ride. The
y-intercept represents the distance remaining when Kristi arrived at
school. |
|
|
|
15.
|
Salvador reads 12 books from the library each month for n months
in a row. Write an expression to show how many books Salvador read in all. Then, find the number of
books Salvador read if he read for 7 months.
a. |  ; 84 books ; 84 books | c. | 12 – n; 19
books | b. | 12n; 84 books | d. | 12 + n; 19 books |
|
|
|
16.
|
Mrs. Williams is deciding between two field trips for her class. The Science
Center charges $135 plus $3 per student. The Dino Discovery Museum simply charges $6 per
student. For how many students will the Science Center charge less than the Dino Discovery
Museum?
a. | Fewer than 45 students | c. | More than 45 students | b. | 132 or fewer
students | d. | 132 or more
students |
|
|
|
17.
|
Solve –14 + s = 32.
a. | s = –46 | c. | s = –18 | b. | s = 18 | d. | s = 46 |
|
|
|
18.
|
Write an equation in slope-intercept form for the line parallel to y =
 x x – 2 that passes through the
point (8, –2).
|
|
|
19.
|
Which graph represents a function?
|
|
|
20.
|
Describe the correlation illustrated by the scatter plot. 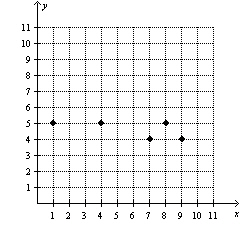 a. | negative correlation | c. | no correlation | b. | positive correlation | d. | cannot
determine |
|
|
|
21.
|
Tell whether the equation  represents a direct
variation. If so, identify the constant of variation. a. | Not a direct variation. | c. | Direct variation; k =  | b. | Direct variation, k =  | d. | Direct variation, k =
–2 |
|
|
|
22.
|
Find the slope of the line. 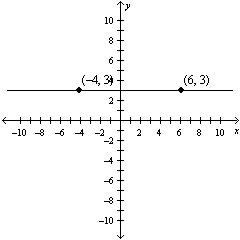 a. | 0 | c. | 10 | b. |  | d. | undefined |
|
|
|
23.
|
Give the domain and range of the relation. a. | D: {–5, 4, 6}; R: {–9, 9, 13} | c. | D: {4, 6, –5, 9, 13,
–9}; R: {0} | b. | D: {–5, 0, 4, 6}; R: {–9, 0, 9,
13} | d. | D: {–9, 0, 9,
13}; R: {–5, 0, 4, 6} |
|
|
|
24.
|
Use intercepts to graph the line described by the equation  .
|
|
|
25.
|
Juan scored 24 points in the first half of the basketball game, and he
scored p points in the second half of the game. Write an expression to determine the number of
points he scored in all Then, find the number of points he scored in all if he scored 11 points in
the second half of the game.
a. | 24p; 35 points | c. | 24 + p; 35 points | b. | 24 – p;
13 points | d. |  ;
13 points ;
13 points |
|
|
|
26.
|
Write the equation  in slope-intercept form. Then graph the line
described by the equation.
|
|
|
27.
|
Solve the inequality 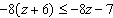 . a. | {all real numbers} | c. | z £  | b. | z £  | d. | no solutions |
|
|
|
28.
|
Choose the scatter plot that best represents the relationship between the number
of students who passed the final exam and the number of students who failed the class. Explain your
answer.
a. | 
This scatter plot shows a positive
correlation between the number of students who passed the final exam and the number of students who
failed the class. | b. | 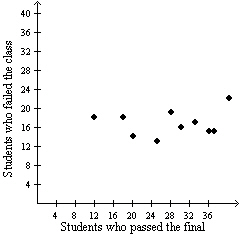
This scatter plot shows
no correlation between the number of students who passed the final exam and the number of students
who failed the class. | c. | 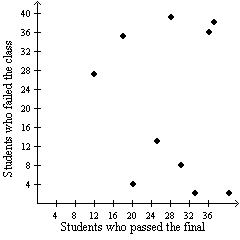
This scatter plot shows
no correlation between the number of students who passed the final exam and the number of students
who failed the class. | d. | 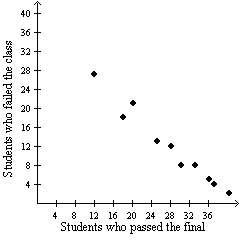
This scatter plot shows a
negative correlation between the number of students who passed the final exam and the number of
students who failed the class. |
|
|
|
29.
|
Solve  .
|
|
|
30.
|
Tell whether the function  is linear. If so, graph the
function. a. |  | c. | 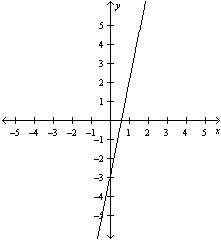 | b. | Not a linear function. | d. | 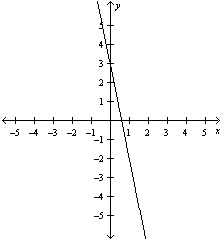 |
|
|
|
31.
|
Tara creates a budget for her weekly expenses. The graph shows how much money is
in the account at different times. Find the slope of the line. Then tell what rate the slope
represents.  a. | The slope is  . The slope means that the amount of money in
the account is decreasing at a rate of $50 every 2 weeks. . The slope means that the amount of money in
the account is decreasing at a rate of $50 every 2 weeks. | b. | The slope is  . The slope means that the amount of money in the account is decreasing at a rate of $50
every week. . The slope means that the amount of money in the account is decreasing at a rate of $50
every week. | c. | The slope is  . The slope means that the amount of money in
the account is decreasing at a rate of $0.02 every week. . The slope means that the amount of money in
the account is decreasing at a rate of $0.02 every week. | d. | The slope is 50. The
slope means that the amount of money in the account is increasing at a rate of $50 every
week. |
|
|
|
32.
|
Tell whether the slope of the line is positive, negative, zero, or
undefined. 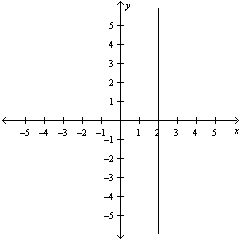 a. | zero | c. | positive | b. | negative | d. | undefined |
|
|
|
33.
|
Give the domain and range of the relation. 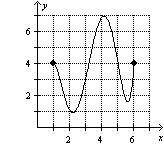 a. | D: 1 £ x £ 6;
R: 1 £ y £ 7 | c. | D: 0 £ x £ 7; R: 1 £ y £ 7 | b. | D: 2 £ x £ 6; R: 4 £ y £ 7 | d. | D: 1 £ x
£ 7; R: 1 £ y £ 6 |
|
|
|
34.
|
Graph a scatter plot using the given data. x | 3 | 6 | 5 | 2 | 7 | 4 | 8 | 1 | y | 4.5 | 6.5 | 6.5 | 3.5 | 6.5 | 4.5 | 8 | 4 | | | | | | | | | |
|
|
|
35.
|
Solve  . a. | p = –22 | c. | p = 10 | b. | p = 22 | d. | p =
–10 |
|
|
|
36.
|
Find the slope of the line that contains  and  .
|
|
|
37.
|
Give the domain and range of the relation. a. | D: {–15, 11, 13}; R: {–8, 5, 6} | b. | D: {–15, 0,
11, 13}; R: {–8, 0, 5, 6} | c. | D: {0}; R: {5, 6, –8, 11, 13,
–15} | d. | D: {–8, 0, 5, 6}; R: {–15, 0, 11, 13} |
|
|
|
38.
|
The graph shows a linear relationship. Find the slope. 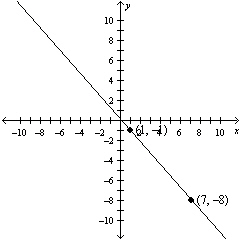
|
|
|
39.
|
Write an equation in slope-intercept form for the line that passes through (3,
7) and (7, 4).
|
|
|
40.
|
Julia wrote 14 letters to friends each month for y months in a
row. Write an expression to show how many total letters Julia wrote.
a. | 14 – y | c. | 14y | b. |  | d. | 14 + y |
|
|
|
41.
|
Give the domain and range of the relation. 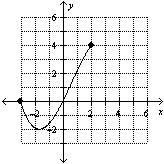 a. | D: –2 £ x £ 4; R: –3 £ y £ 2 | c. | D: –3 £ x £ 2; R: –3 £ y £ 6 | b. | D: –3 £
x £ 2; R: 0 £ y £ 4 | d. | D: –3 £ x £ 2; R: –2 £ y £ 4 |
|
|
|
42.
|
Marco’s Drama class is performing a play. He wants to buy as many tickets
as he can afford. If tickets cost $2.50 each and he has $14.75 to spend, how many tickets can he
buy?
a. | 6 tickets | c. | 0 tickets | b. | 5 tickets | d. | 4 tickets |
|
|
|
43.
|
Which situation best describes a positive correlation?
a. | The amount of gasoline in a car and how far the car has traveled | b. | The temperature on
Tuesdays | c. | The size of a sundae and the amount of calories it contains | d. | The size of a
snowball and how long it has been melting |
|
|
|
44.
|
a. | Lines 1 and 4 are parallel. | c. | All four lines are
parallel. | b. | Lines 1 and 2 are parallel. | d. | Lines 2 and 3 are parallel. |
|
|
|
45.
|
Find the slope of the line. 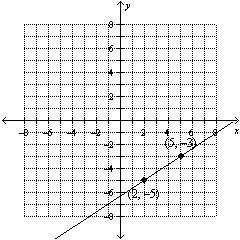
|
|
|
46.
|
Identify the lines that are perpendicular:  ;  ;  ; 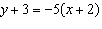
|
|
|
47.
|
Write an equation in point-slope form for the line that has a slope of  and contains the point (–8, –7). a. | y – 7 =  (x – 8) (x – 8) | c. | x – 8
=  (y – 7) (y – 7) | b. | y + 7 =  (x + 8) (x + 8) | d. | y + 8 =  (x + 7) (x + 7) |
|
|
|
48.
|
Solve  for x.
|
|
|
49.
|
Tell whether the set of ordered pairs 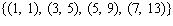 satisfies a
linear function. Explain. a. | Yes; there is a constant change in x that corresponds to a constant change in
y. | b. | No; there is a constant change in x that corresponds to a constant change in
y. | c. | Yes; there is no constant change in x that corresponds to a constant change in
y. | d. | No; there is no constant change in x that corresponds to a constant change in
y. |
|
|
|
50.
|
Find the x- and y-intercepts.  a. | x-intercept: 10, y-intercept: 5 | c. | x-intercept: 5,
y-intercept: 10 | b. | x-intercept: –10,
y-intercept: 5 | d. | x-intercept: 10, y-intercept: –5 |
|