Multiple Choice
Identify the
choice that best completes the statement or answers the question.
|
|
|
1.
|
Which of the following equations represents the data given
below?
x | 0 | 1 | 2 | 3 | 4 | 5 | 6 | y | –7 | –2 | 13 | 38 | 73 | 118 | 173 | | | | | | | | |
A. | y = 5x2 –
7 | B. | y = 5x2 + 7 | C. | y = x2 -
7x | D. | y = x2 +
7x |
|
|
|
2.
|
Which of the following equations represents the data given
below?
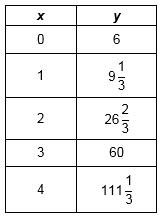
A. | y = 60x3 + 26.67x2
+ 9.33x + 6 | B. | y =
14x3 + 16x2 + 19x +
6 | C. | y = 3.33x3 + 17.33x2 +
33.33x + 6 | D. | y =
0.33x3 + 6x2 – 3x +
6 |
|
|
|
3.
|
Look at the table shown below.
What type of function is represented in the
table?
A. | Linear | B. | Exponential | C. | Quadratic | D. | None of
these |
|
|
|
4.
|
Look at the table shown below.
Which of the following represents the quadratic function relating the
variables?
A. | f(x) = 3x2 – 2x +
4 | B. | f(x) = 3x2 + 2x +
4 | C. | f(x) = 6x2 – 2x +
4 | D. | f(x) = 6x2 – 5x +
4 |
|
|
|
5.
|
Each table shown below represents a
function.
Table 1 | | Table 2 | | x | y = f(x) | | x | y = f(x) | | 0 | 5 | | 0 | 5 | | 1 | 6 | | 1 | 10 | | 2 | 13 | | 2 | 21 | | 3 | 26 | | 3 | 38 | | 4 | 45 | | 4 | 61 | | | | | | | | | |
Which
of the following is NOT a true statement about the functions representing the data in the
tables?
A. | Both tables represent quadratic
functions. | B. | The value of A is
the same in both functions. | C. | The value of B in
the function representing Table 1 is the opposite of the value of B in the function
representing Table 2. | D. | The second difference in
Table 1 is 3. |
|
|
|
6.
|
Which of the following best describes the relationship in
the data in the table below?
A. | Linear Function | B. | Quadratic Function | C. | Exponential
Function | D. | None of the Above |
|
|
|
7.
|
Look at the data in the table below.
x | f(x) | 1 | -11 | 2 | -34 | 3 | -69 | 4 | -116 | 5 | -175 | | |
Which of the following quadratic functions best
models the data in the table?
A. | f(x) =
-3x2 – 8x | B. | f(x) = 4x2 – 15x | C. | f(x) = x2 –
12x | D. | f(x) =
-6x2 – 5x |
|
|
|
8.
|
Which of the following tables shows data related by the
quadratic function f(x) = 3x2 - 16x?
|
|
|
9.
|
A ball is thrown upward with an initial velocity of 30
meters per second. The position of the ball over time is recorded in the table
below.
Time in
Seconds, x | Distance from the Ground in meters,
f(x) | 0 | 0 | 1 | 25 | 2 | 40 | 3 | 45 | 4 | 40 | 5 | 25 | | |
Which quadratic function models the
data?
A. | f(x) = -5x2 +
30x | B. | f(x) =
30x2 | C. | f(x) =
30x2 – 5x | D. | f(x) =
-5x2 – 30x |
|
|
|
10.
|
Does the data in the table below show a cubic
function? If so, which function represents the data?
A. | yes, y = 0.5x3 +
5 | B. | yes, y = 2x3 +
5 | C. | yes, y = 12x3 +
5 | D. | Not a cubic function |
|
|
|
11.
|
What type of function is represented in the
table?
A. | Linear | B. | Exponential | C. | Quadratic | D. | Cubic |
|
|
|
12.
|
Values from the function g(x) are shown in the
table below.
Which of the following functions best
represents the function g(x)?
A. | g(x) = 8x | B. | g(x) = 8x2 | C. | g(x) = 8x3 | D. | g(x) = 8x |
|
|
|
13.
|
The volume of a set of shipping containers is shown in the
table below.
Width of base, w
(feet) | Volume, V (cubic feet) | 0 | 0 | 1 | 4.5 | 2 | 20 | 3 | 52.5 | 4 | 108 | 5 | 192.5 | | |
Which of the following equations best represents the volume, V, based on the
width of the base of the container, w?
A. | V = w3 + 2.5w2 +
w | B. | V = w3 + 4.5w2 +
w | C. | V = 6w3 + 4.5w2 +
11w | D. | V =
6w3 + 2.5w |
|
|
|
14.
|
Look at the table shown below.
What type of function is represented in the
table?
A. | Linear | B. | Exponential | C. | Quadratic | D. | Cubic |
|
|
|
15.
|
Look at the table shown below.
Which of the following represents the cubic function relating the
variables?
A. | y = 2x3 + x2 +
3x + 1 | B. | y =
x3 + 2x2 + 3x + 1 | C. | y = 2x3 + 3x2 + x +
1 | D. | y = 3x3 + x2 +
2x + 1 |
|