Multiple Choice
Identify the
choice that best completes the statement or answers the question.
|
|
|
1.
|
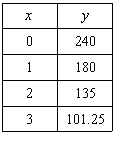
Look at the table shown below.
Which of the following represents the common
ratio in the table?
A. |  | B. | 3 | C. | 1 | D. | 9 |
|
|
|
2.
|
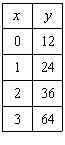
Look at the table shown below.
Which of the following statements is NOT true
about the table?
A. | The function relating the variables is y =
4(1.5)x. | B. | The function is
exponential. | C. | The common ratio is
4. | D. | The function is
increasing. |
|
|
|
3.
|
The table below represents an exponential
function.
Which of the following is the function relating
the variables?
A. | y = 2(4)x | B. | y = 8(4)x | C. | y = 4(2)x | D. | y = 4(x)2 |
|
|
|
4.
|
The table below represents an exponential
function.
Which of the following is the function relating
the variables?
A. |  | B. | y = 2(6)x | C. | y = 6(2)x | D. |  |
|
|
|
5.
|
Look at the function rule shown below.
y =
5(1.2)x
Which of the following tables
contains values of the function?
|
|
|
6.
|
Which of the following functions best models the given
data?
x | 0 | 1 | 2 | 3 | 4 | 5 | 6 | y | 120 | 91 | 68 | 50.7 | 37.8 | 28.5 | 21.3 | | | | | | | | |
A. | y = 120 – 16.5x | B. | y = 120 – 29x | C. | y =
120(0.75)x | D. | y =
120(0.25)x |
|
|
|
7.
|
After receiving large amounts of rain, the mosquito
population of a certain area in Texas was growing quickly. The table below shows the increase
in the number of mosquitos in the area since they started calculating their
population.
# of Days,
x | # of mosquitos,
f(x) | 0 | 250 | 1 | 295 | 2 | 350 | 3 | 410 | 4 | 485 | 5 | 572 | | |
Which of the following functions best models
the situation above?
A. | f(x) =
250(1.18)x | B. | f(x) =
250(5.90)x | C. | f(x) = 250 +
64.4x | D. | f(x) = 250 +
45x |
|
|
|
8.
|
Keiana’s grandparents opened a savings account for her
when she was born. She rarely deposits or withdraws money from this account, but does earn
interest. Her savings over time is shown in the table.
5-year interval,
x | Years since starting the account | Amount in
savings, f(x) | 0 | 0 | $10,000 | 1 | 5 | $10,350 | 2 | 10 | $10,500 | 3 | 15 | $11,000 | 4 | 20 | $11,250 | 5 | 25 | $11,600 | | | |
Use
an exponential model based on the given data set to predict how much will she have in savings when
she turns 40.
A. | $11,941 | B. | $12,668 | C. | $24,273 | D. | $32,620 |
|
|
|
9.
|
When Carlton purchased a new truck, he knew its value would
depreciate over time. The table below shows the car’s value for the first five years
after it was purchased.
Years since
purchase, x | Value of car,
f(x) | 0 | $39,900 | 1 | $35,500 | 2 | $30,900 | 3 | $27,000 | 4 | $23,999 | 5 | $21,000 | | |
Use the given data set to
predict when the car’s value will drop below $10,000.
A. | 7 years | B. | 8
years | C. | 10 years | D. | 11
years |
|
|
|
10.
|
The population of a small town started to decrease when the
job market changed. The table below shows the town’s population since 1985.
5-year interval,
x | Year | Town’s population,
f(x) | 0 | 1980 | 2000 | 1 | 1985 | 1700 | 2 | 1990 | 1500 | 3 | 1995 | 1250 | 4 | 2000 | 1000 | 5 | 2005 | 900 | | | |
The exponential function
f(x) = 2000(0.85)x can be used to model this situation. Which of the following statements does not
accurately describe this situation and its function model?
A. | The function that models the situation is an exponential decay
function. | B. | The town is decreasing in size by about 15% every five
years. | C. | The population of the town will be less than 400 by the year
2020. | D. | The population in the year 2000 was half the 1980
population. |
|
Short Answer
|
|
|
State whether the table represents an exponential function or not. If the table
represents an exponential function, write the common ratio and the equation for the function.
|
|
|
11.
|
 .
|
|
|
12.
|
 .
|
|
|
13.
|
|
|
|
Use the following table for problems 14 and 15. 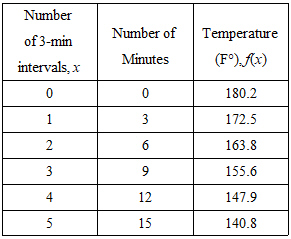
|
|
|
14.
|
Write an exponential model for this data.
|
|
|
15.
|
Use the exponential model to determine the approximate temperature after  hour.
|
|
|
16.
|
Use finite differences to determine if the table represents an exponential
function. 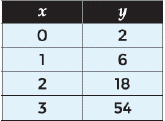
|
|
|
17.
|
Identify if
the table represents an exponential function or not. If the table represents an exponential function,
identify the common ratio. 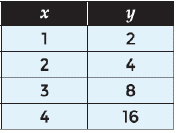
|
|
|
18.
|
Complete the table below to represent the situation. 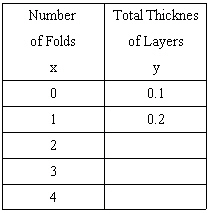
|
|
|
19.
|
Determine whether a linear model or an exponential model would be most
appropriate for the data. Explain how you made your decision. 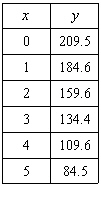
|
|
|
20.
|
Calulate the average ratio between successive y-values. 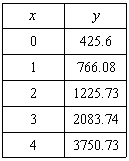
|